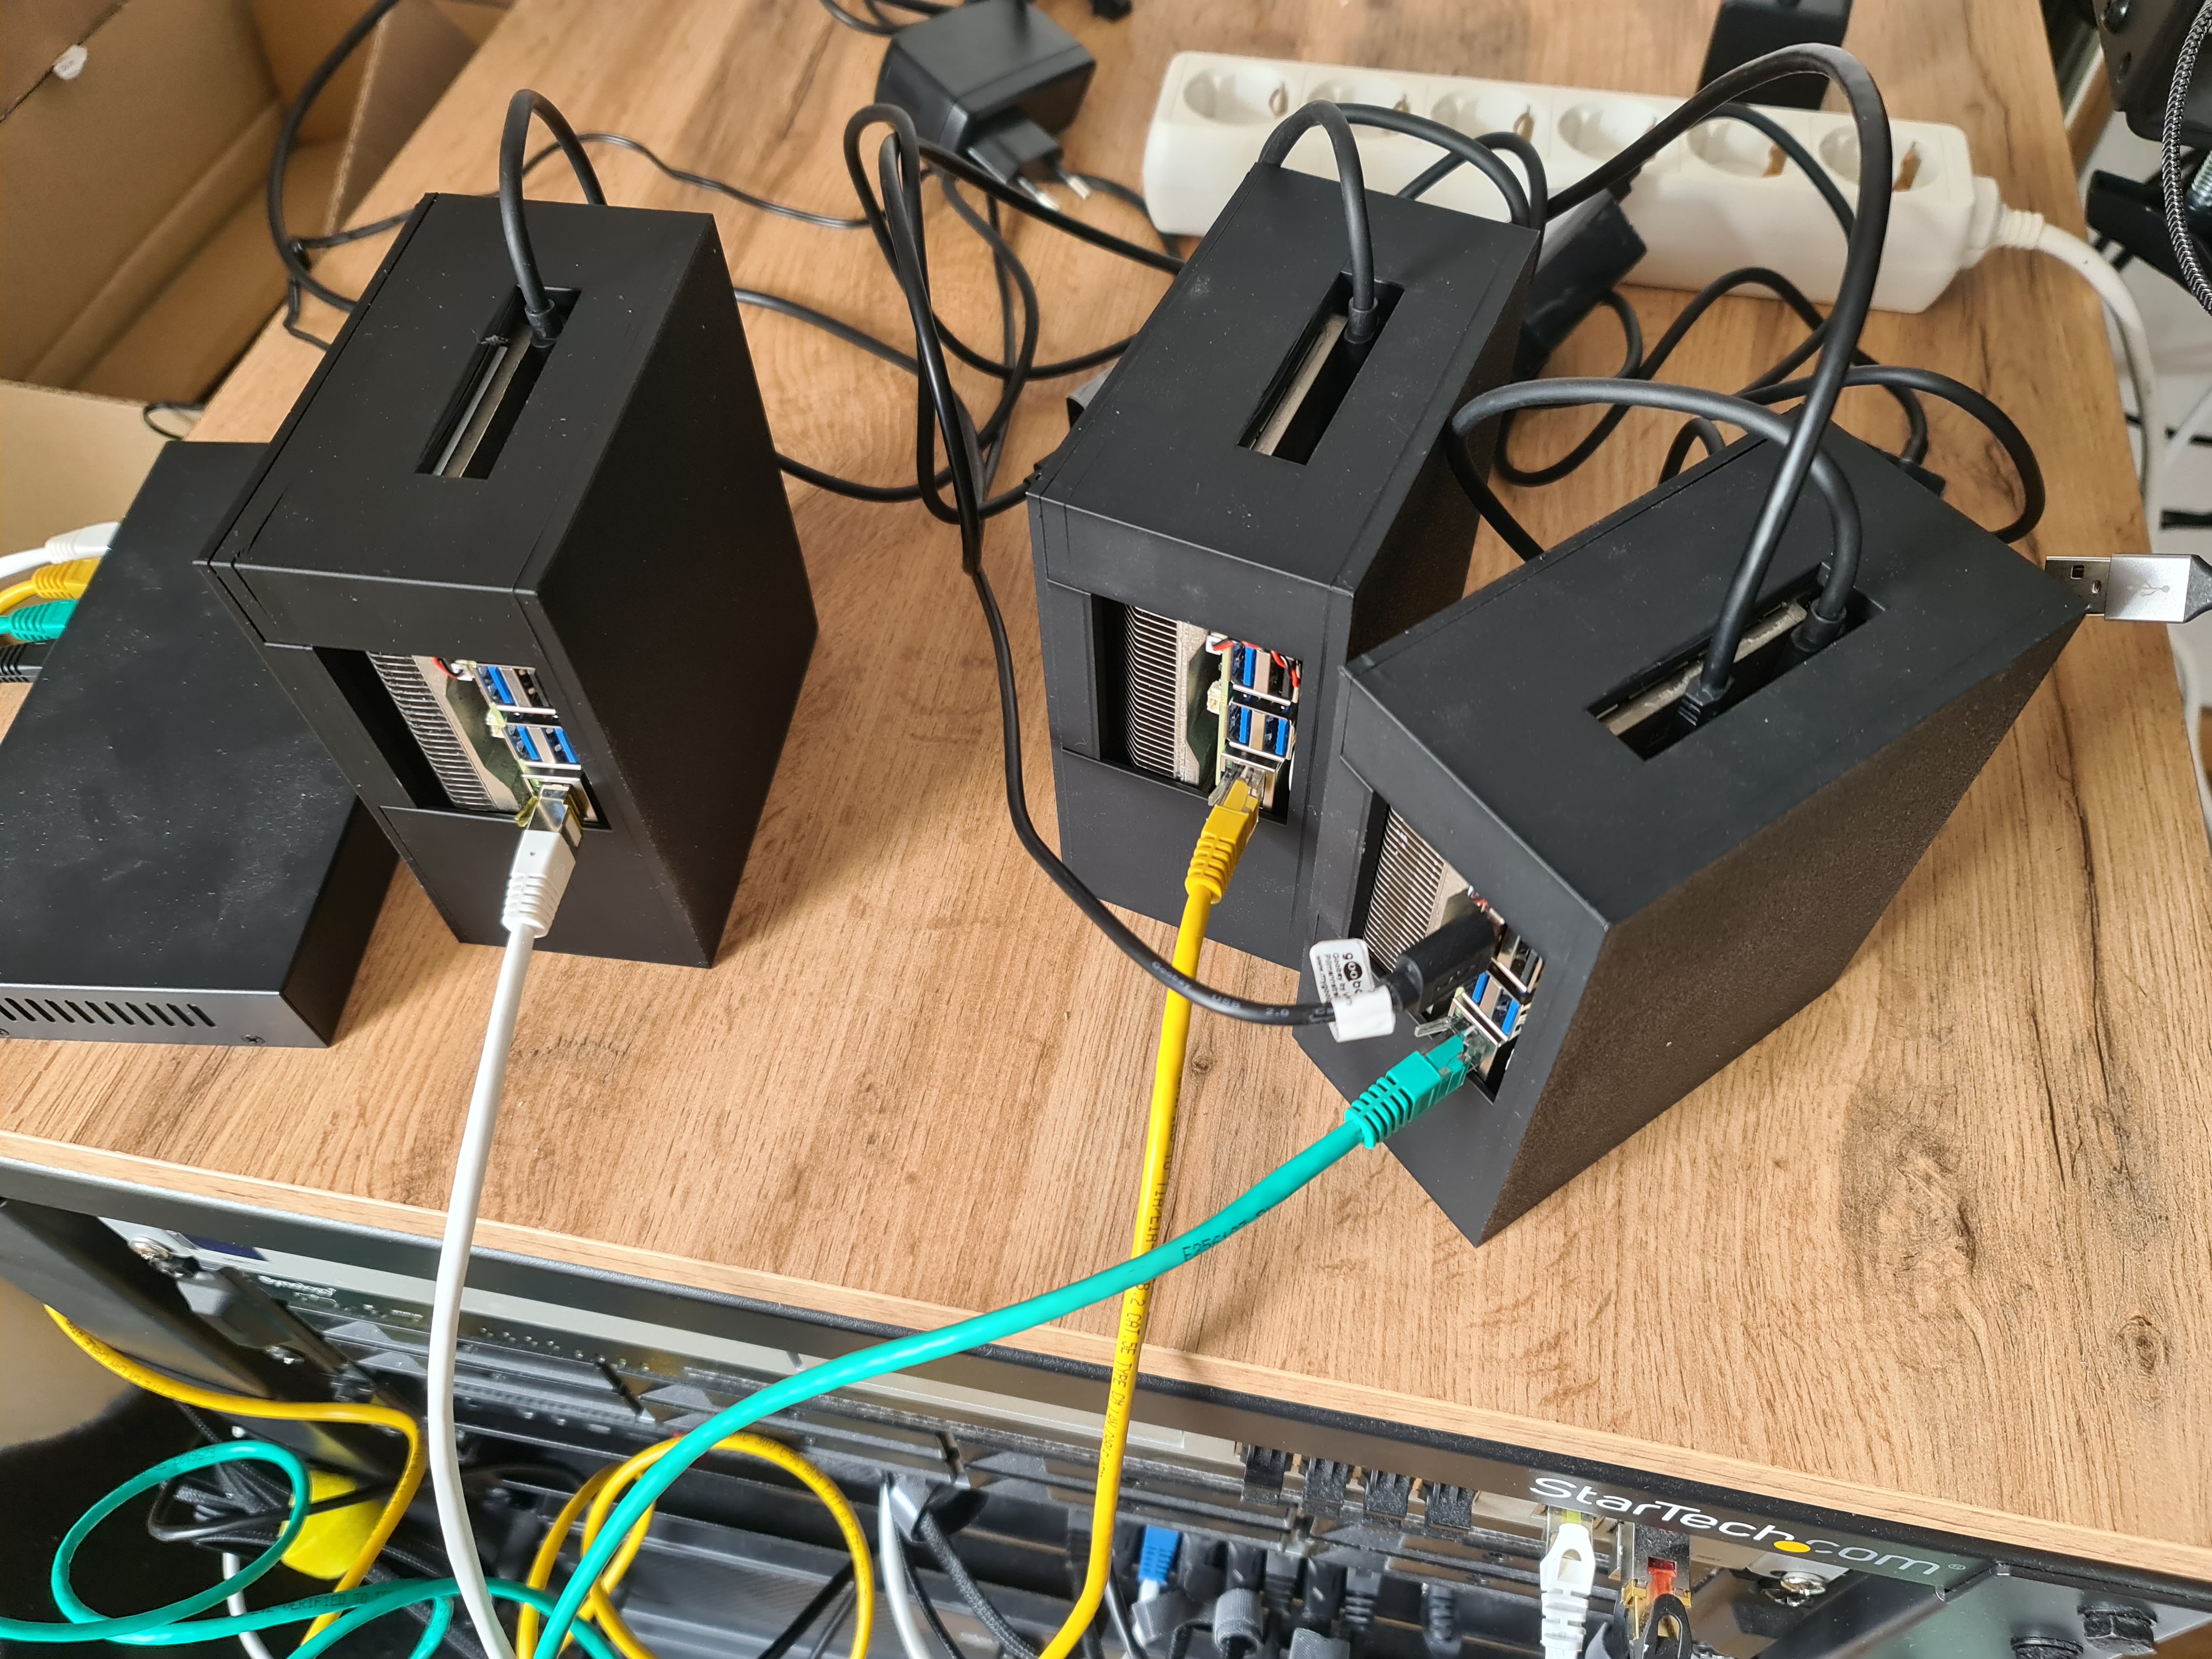
Radxa X4 N100 Cluster Build Log - Part 6: Provisioning the Cluster using Talos + Omni
I decided on using Talos OS, since I have a few other projects running on it and am familiar with it. Since this is a homelab, I can use Omni for free, because the license allows non-production use.
This guide requires a configured and running Omni instance or the usage of Omni Cloud. Any other Kubernetes distribution and cluster manager will work just fine with radxa X4, but this guide is tailored to Talos und Omni.
Installation
The first step starts with an issue related to the Radxa X4 boards and some other boards. The issue is that the SMBIOS does not carry a unique UUID. This is a problem for Omni, since it uses the UUID to identify the nodes. There are issues, that track this problem, so maybe sometime in the future this is not a problem anymore.
https://github.com/siderolabs/omni/issues/38 https://github.com/siderolabs/talos/issues/9400
The solution is to set a custom UUID in the installation media. This can be achieved as follows:
Starting with your first control plane node:
Generate kernel arguments for your N nodes:
# https://www.talos.dev/v1.9/advanced/metal-network-configuration/#supplying-network-configuration-to-a-running-talos-machine

NODES=${1:-3}
BASE_PARAM="0xf="
PREFIX="talos.environment=INSTALLER_META_BASE64="

uuid() {
    # generate a random UUID
    local uuid
    uuid=$(cat /proc/sys/kernel/random/uuid)
    echo "$uuid"
}

for i in $(seq 0 $((NODES - 1))); do
    PARAM=$(uuid)
    echo "Using uuid: $PARAM"
    PARAM="$BASE_PARAM$PARAM"
    PARAM=$(echo -n "$PARAM" | gzip -9 | base64 -w 0)
    echo "$PREFIX$PARAM"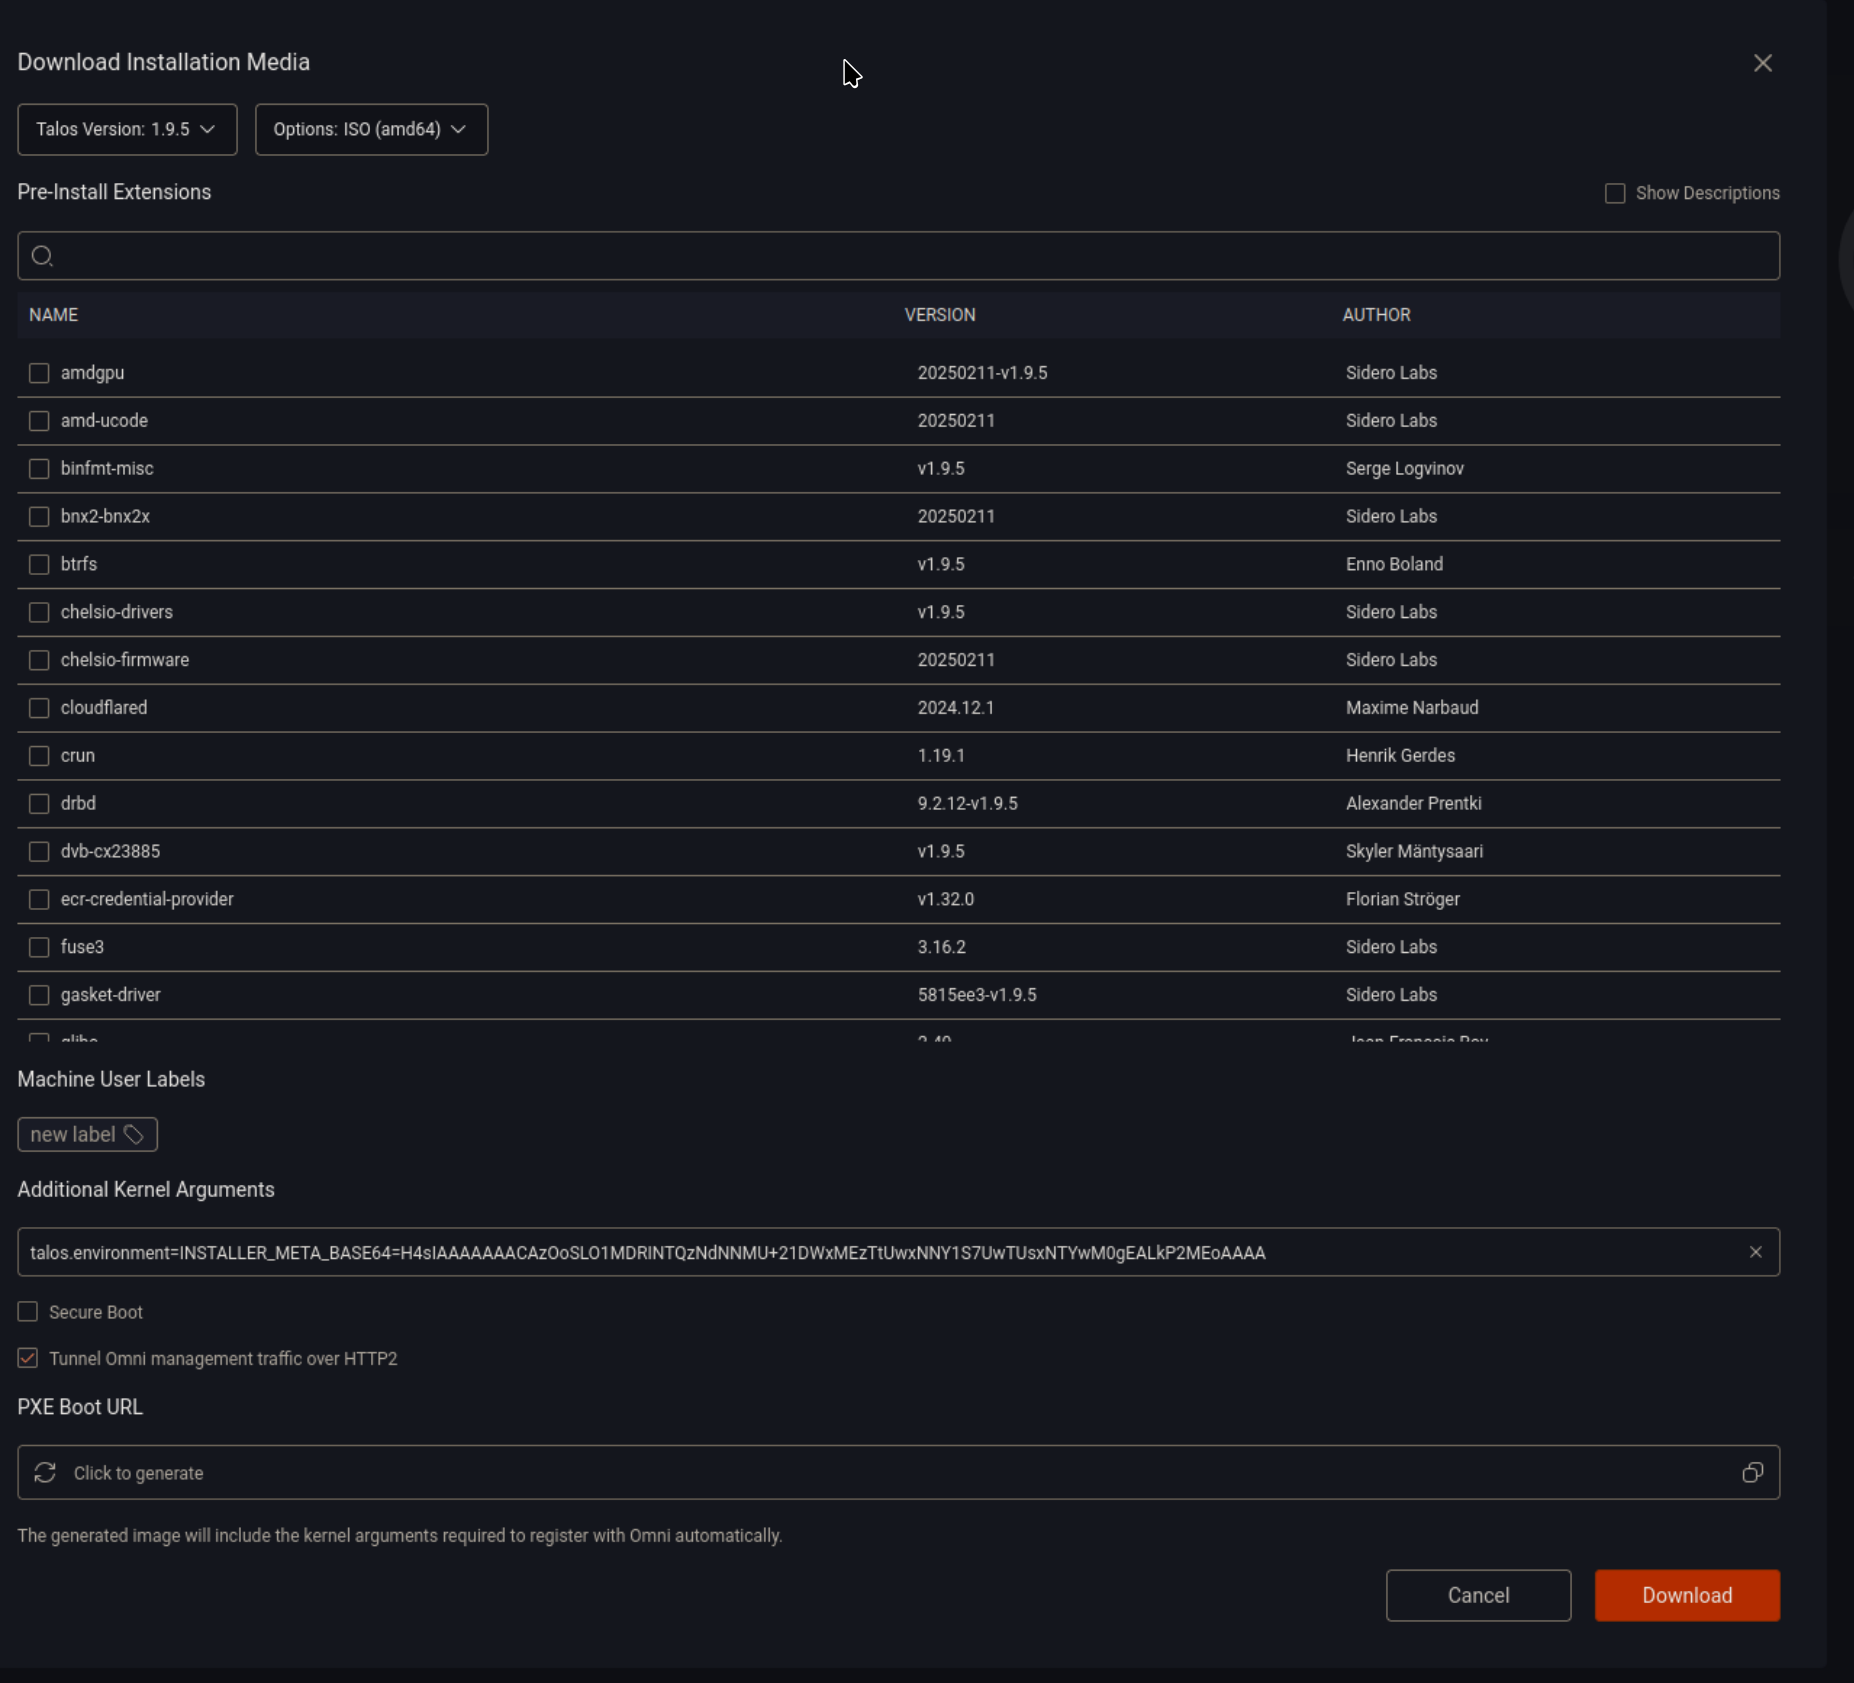
done- Create a new installation media using Omni
- pick ISO
- set the additional Kernel Argument to your generated UUID so i.e. “talos.environment=INSTALLER_META_BASE64=H4sIAAAAAAACAzOoSLO1MDRINTQzNdNNMU+21DWxMEzTtUwxNNY1S7UwTUsxNTYwM0gEALkP2MEoAAAA”
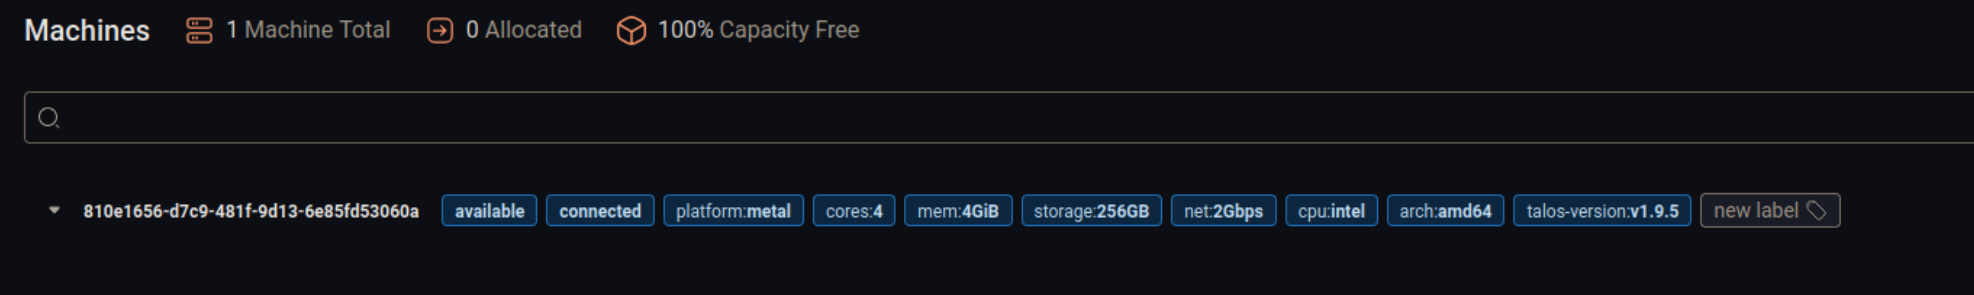
Once the machine is connected and able to talk to Omni you should see it in your Omni machines overview.
Now to create a cluster, we need to head over to Clusters -> Create Cluster and select the newly added node as the control plane node.
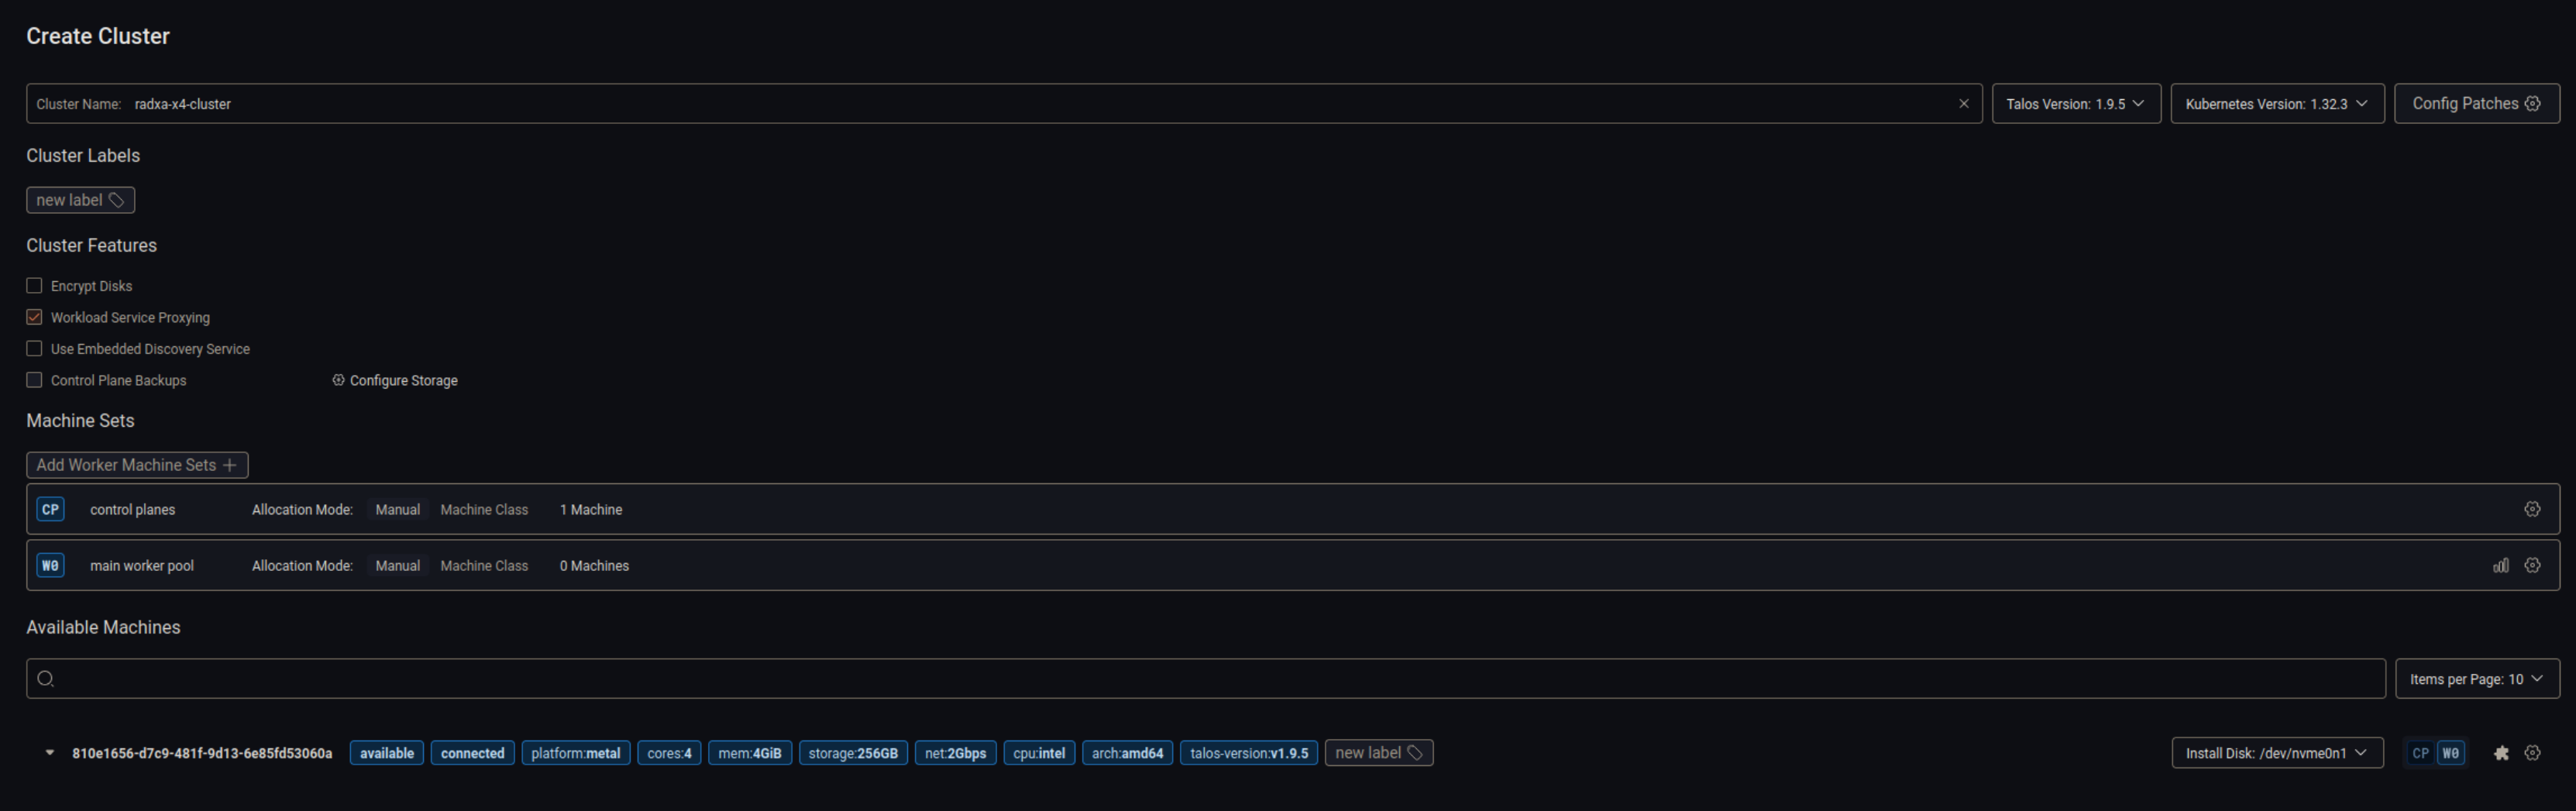
Once you click “Create Cluster” you will be asked if you want to apply the patch to schedule user workloads on this control plane node. If this is a single node cluster, you should select “Yes”.
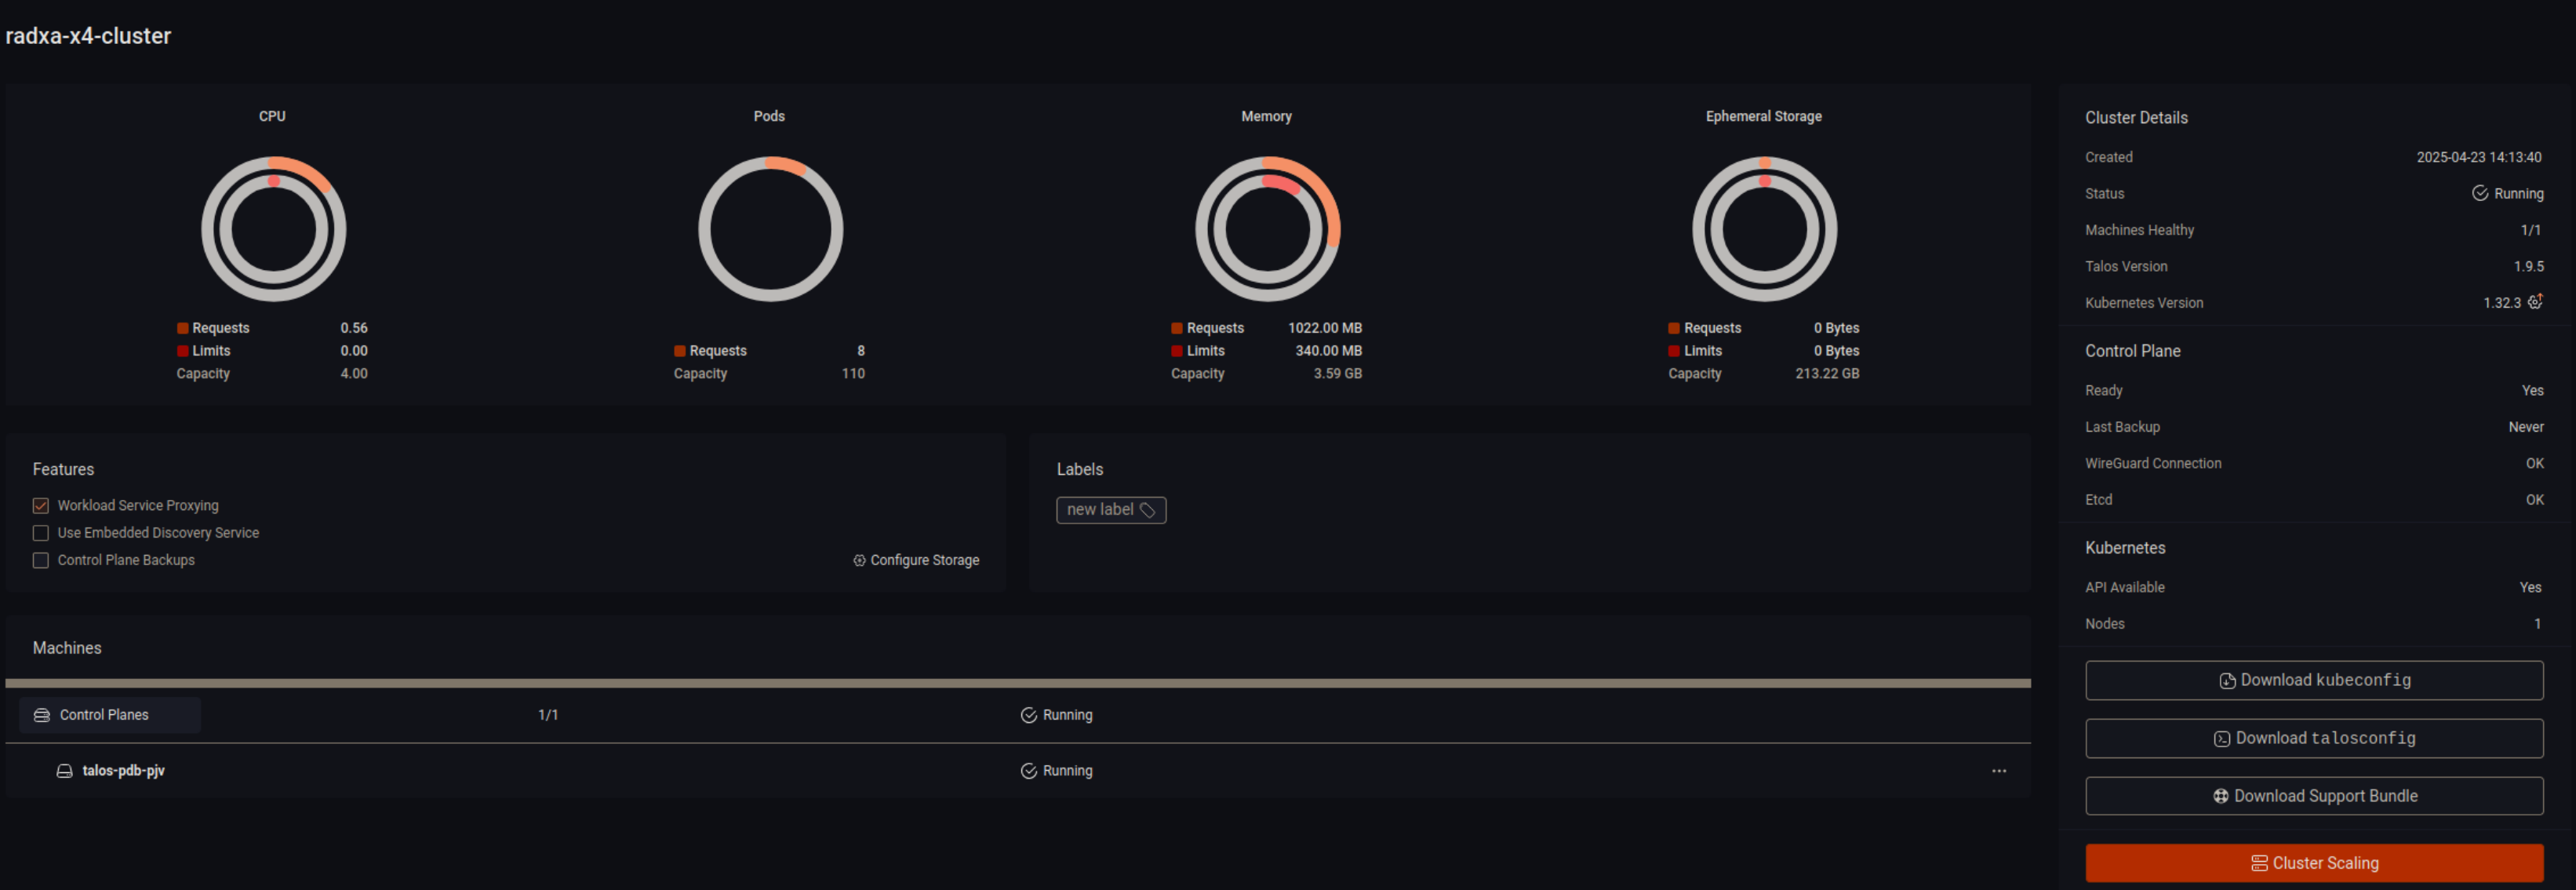
After some time your cluster should be healthy and running.
Now repeat the process inclusive the UUID generation for the other nodes.
Now instead of creating the cluster we will join the cluster using the Cluster Scaling option.
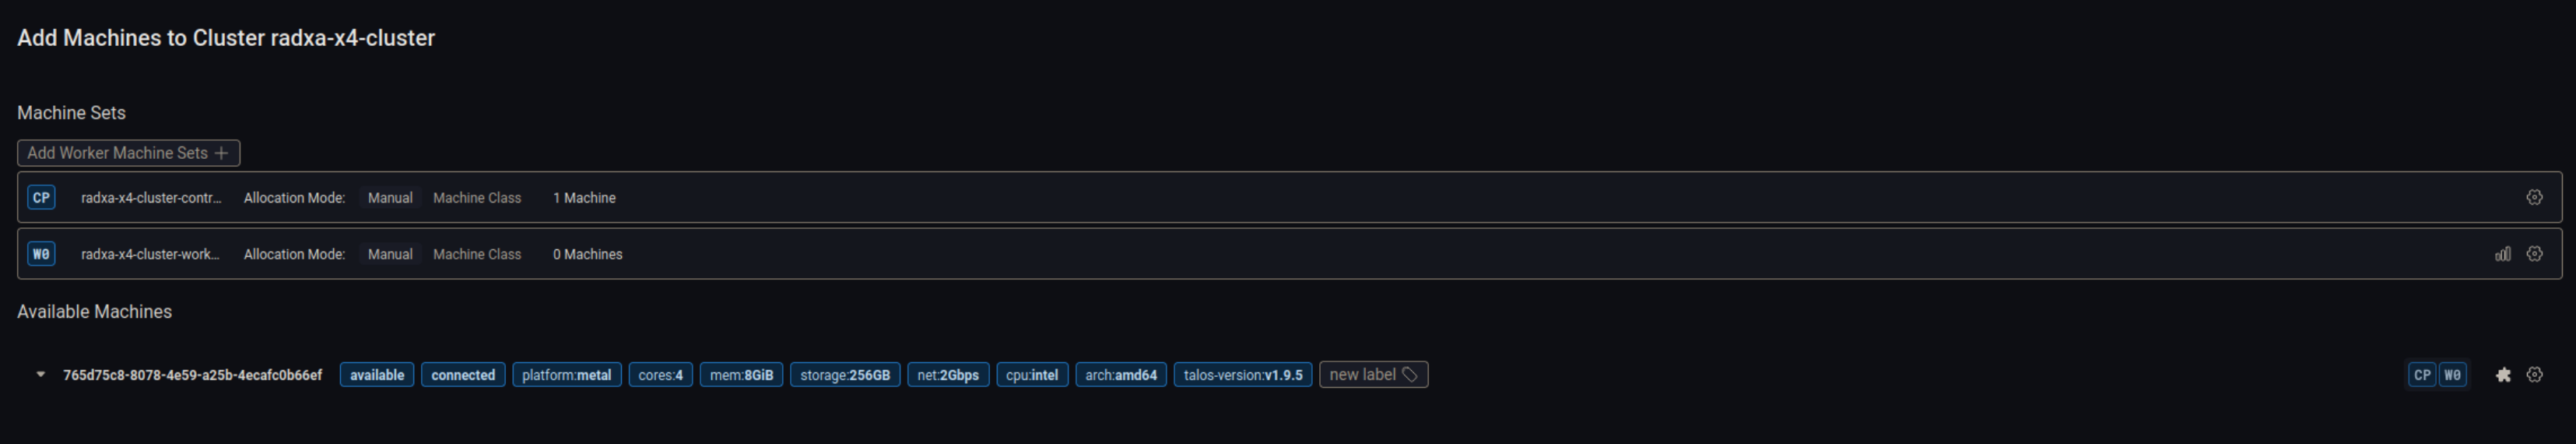
Just like before, make sure the correct install disk is selected and configure if it should join as cp or worker.

Now you are done. You can now use the cluster as you would with any other Talos / Kubernetes cluster.
Fan Control
If you followed the build logs and / or use the fan-manager, your nodes should be a bit noisy, since the fans run at max speed.
To control the fan speed on each node, we need to run the fan-manager container on each node. This can be achieved by using a daemon set.
Create a privileged namespace using:
kubectl create ns fan-manager kubectl label namespace fan-manager pod-security.kubernetes.io/enforce=privilegedCreate the daemon set using:
apiVersion: apps/v1
kind: DaemonSet
metadata:
  name: fan-manager
  namespace: fan-manager
  labels:
    app: fan-manager
spec:
  selector:
    matchLabels:
      app: fan-manager
  template:
    metadata:
      labels:
        app: fan-manager
    spec:
      tolerations:
        - key: "node-role.kubernetes.io/master"
          operator: Exists
          effect: NoSchedule
        - key: "node-role.kubernetes.io/control-plane"
          operator: Exists
          effect: NoSchedule
      containers:
        - name: fan-manager
          image: ghcr.io/0xc9c3/radxa-x4-cluster/fan-manager:main
          imagePullPolicy: Always
          args: [ "-p", "/dev/ttyS0" ]
          securityContext:
            privileged: true
kubectl apply -f fan-manager.yamlIf you have not installed the uf2 yet, the fan won’t change. I recommend using a live image to install the uf2 and then rebooting the node. I chose ubuntu server live.
- Choose “try or install” then change the tty using
CTRL + ALT + F2. - Install docker using https://get.docker.com/
- retrieve the fan-manager binary
docker run -v ".:/out" --entrypoint bash ghcr.io/0xc9c3/radxa-x4-cluster/fan-manager:main -c "cp /usr/bin/fan-manager /out"- Install gpiod
apt-get update && apt-get install -y gpiod- run the fan-manager binary. if everything works, you should see the fan speed change.
./fan-manager -i- reboot back into talos
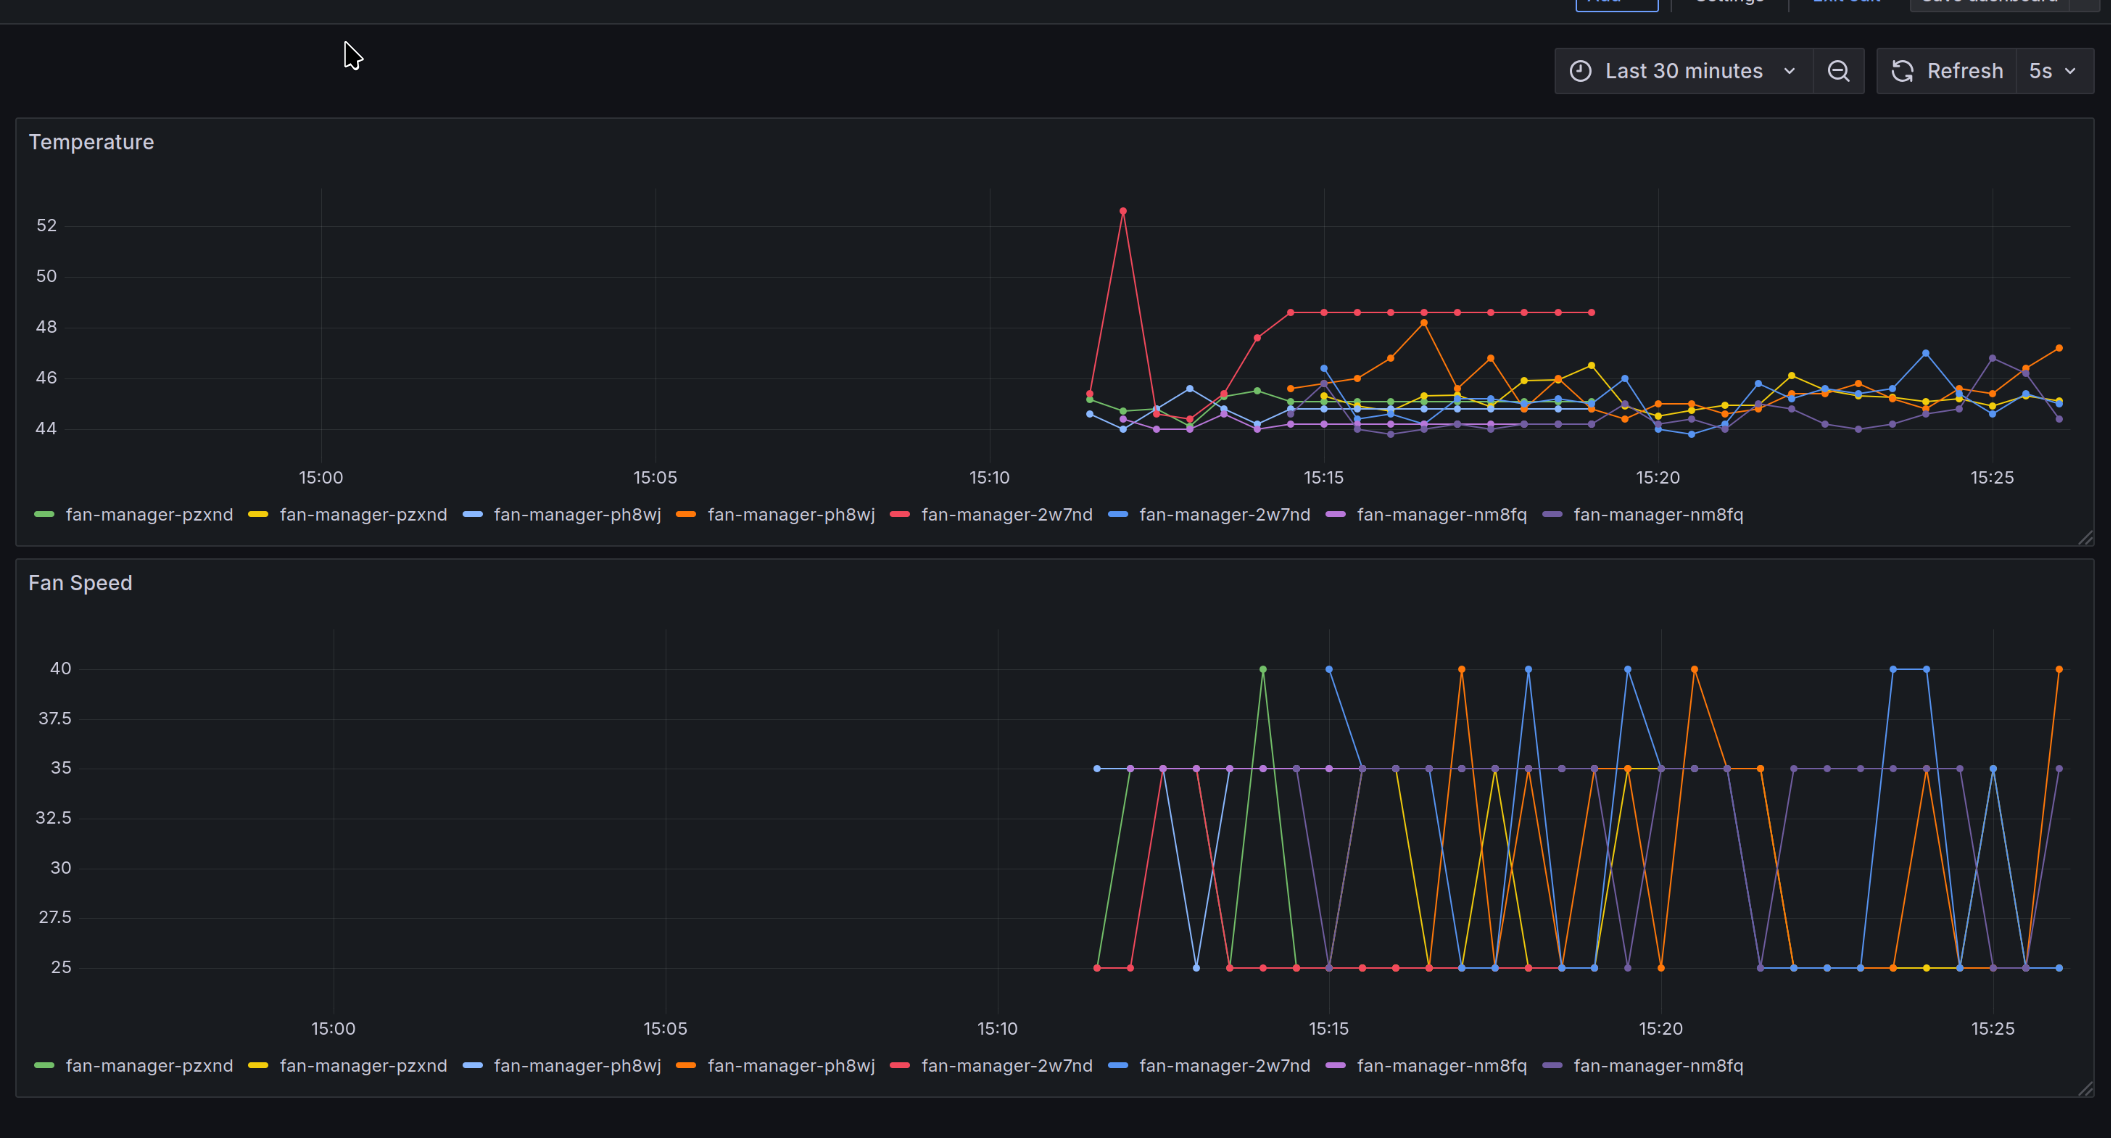
Once the node is back up and the fan-manager pod is running you should be able to see the fan speed change depending on the temperature.
This is kinda awkward for now, since gpiod could not access gpiochip0 inside docker, even with privileged, tty, mounts, etc.
Conclusion
That is all for now. I will be doing a few more posts about the cluster depending on how much time I have.
Everything related can be found in the repository: https://github.com/0xC9C3/radxa-x4-cluster
The next post will be some cost numbers and electricity usage.
Next up: Part 6
Update
I added a prometheus exporter to the fan-manager container. You can create a PodMonitor to scrape the metrics.
i.e. via
apiVersion: monitoring.coreos.com/v1
kind: PodMonitor
metadata:
  name: fan-manager
  namespace: kube-prom
spec:
  selector:
    matchLabels:
      app: fan-manager
  namespaceSelector:
    matchNames:
      - fan-manager
  podMetricsEndpoints:
    - port: metrics
      interval: 10s
Using those you can create easily some nice dashboards in Grafana.
{
  "annotations": {
    "list": [
      {
        "builtIn": 1,
        "datasource": {
          "type": "grafana",
          "uid": "-- Grafana --"
        },
        "enable": true,
        "hide": true,
        "iconColor": "rgba(0, 211, 255, 1)",
        "name": "Annotations & Alerts",
        "type": "dashboard"
      }
    ]
  },
  "editable": true,
  "fiscalYearStartMonth": 0,
  "graphTooltip": 0,
  "id": 29,
  "links": [],
  "panels": [
    {
      "datasource": {
        "type": "prometheus",
        "uid": "prometheus"
      },
      "fieldConfig": {
        "defaults": {
          "color": {
            "mode": "palette-classic"
          },
          "custom": {
            "axisBorderShow": false,
            "axisCenteredZero": false,
            "axisColorMode": "text",
            "axisLabel": "",
            "axisPlacement": "auto",
            "barAlignment": 0,
            "barWidthFactor": 0.6,
            "drawStyle": "line",
            "fillOpacity": 0,
            "gradientMode": "none",
            "hideFrom": {
              "legend": false,
              "tooltip": false,
              "viz": false
            },
            "insertNulls": false,
            "lineInterpolation": "linear",
            "lineWidth": 1,
            "pointSize": 5,
            "scaleDistribution": {
              "type": "linear"
            },
            "showPoints": "auto",
            "spanNulls": false,
            "stacking": {
              "group": "A",
              "mode": "none"
            },
            "thresholdsStyle": {
              "mode": "off"
            }
          },
          "mappings": [],
          "thresholds": {
            "mode": "absolute",
            "steps": [
              {
                "color": "green"
              },
              {
                "color": "red",
                "value": 80
              }
            ]
          }
        },
        "overrides": []
      },
      "gridPos": {
        "h": 8,
        "w": 24,
        "x": 0,
        "y": 0
      },
      "id": 2,
      "options": {
        "legend": {
          "calcs": [],
          "displayMode": "list",
          "placement": "bottom",
          "showLegend": true
        },
        "tooltip": {
          "hideZeros": false,
          "mode": "single",
          "sort": "none"
        }
      },
      "pluginVersion": "11.6.1",
      "targets": [
        {
          "disableTextWrap": false,
          "editorMode": "builder",
          "expr": "temperature",
          "fullMetaSearch": false,
          "includeNullMetadata": true,
          "legendFormat": "{{pod}}",
          "range": true,
          "refId": "A",
          "useBackend": false
        }
      ],
      "title": "Temperature",
      "type": "timeseries"
    },
    {
      "datasource": {
        "type": "prometheus",
        "uid": "prometheus"
      },
      "fieldConfig": {
        "defaults": {
          "color": {
            "mode": "palette-classic"
          },
          "custom": {
            "axisBorderShow": false,
            "axisCenteredZero": false,
            "axisColorMode": "text",
            "axisLabel": "",
            "axisPlacement": "auto",
            "barAlignment": 0,
            "barWidthFactor": 0.6,
            "drawStyle": "line",
            "fillOpacity": 0,
            "gradientMode": "none",
            "hideFrom": {
              "legend": false,
              "tooltip": false,
              "viz": false
            },
            "insertNulls": false,
            "lineInterpolation": "linear",
            "lineWidth": 1,
            "pointSize": 5,
            "scaleDistribution": {
              "type": "linear"
            },
            "showPoints": "auto",
            "spanNulls": false,
            "stacking": {
              "group": "A",
              "mode": "none"
            },
            "thresholdsStyle": {
              "mode": "off"
            }
          },
          "mappings": [],
          "thresholds": {
            "mode": "absolute",
            "steps": [
              {
                "color": "green"
              },
              {
                "color": "red",
                "value": 80
              }
            ]
          }
        },
        "overrides": []
      },
      "gridPos": {
        "h": 10,
        "w": 24,
        "x": 0,
        "y": 8
      },
      "id": 1,
      "options": {
        "legend": {
          "calcs": [],
          "displayMode": "list",
          "placement": "bottom",
          "showLegend": true
        },
        "tooltip": {
          "hideZeros": false,
          "mode": "single",
          "sort": "none"
        }
      },
      "pluginVersion": "11.6.1",
      "targets": [
        {
          "datasource": {
            "type": "prometheus",
            "uid": "prometheus"
          },
          "disableTextWrap": false,
          "editorMode": "builder",
          "exemplar": false,
          "expr": "fan_speed",
          "format": "time_series",
          "fullMetaSearch": false,
          "includeNullMetadata": true,
          "instant": false,
          "legendFormat": "{{pod}}",
          "range": true,
          "refId": "A",
          "useBackend": false
        }
      ],
      "title": "Fan Speed",
      "type": "timeseries"
    }
  ],
  "preload": false,
  "refresh": "5s",
  "schemaVersion": 41,
  "tags": [],
  "templating": {
    "list": []
  },
  "time": {
    "from": "now-30m",
    "to": "now"
  },
  "timepicker": {},
  "timezone": "browser",
  "title": "New dashboard",
  "uid": "del64bj96f1mof",
  "version": 6
}